Background
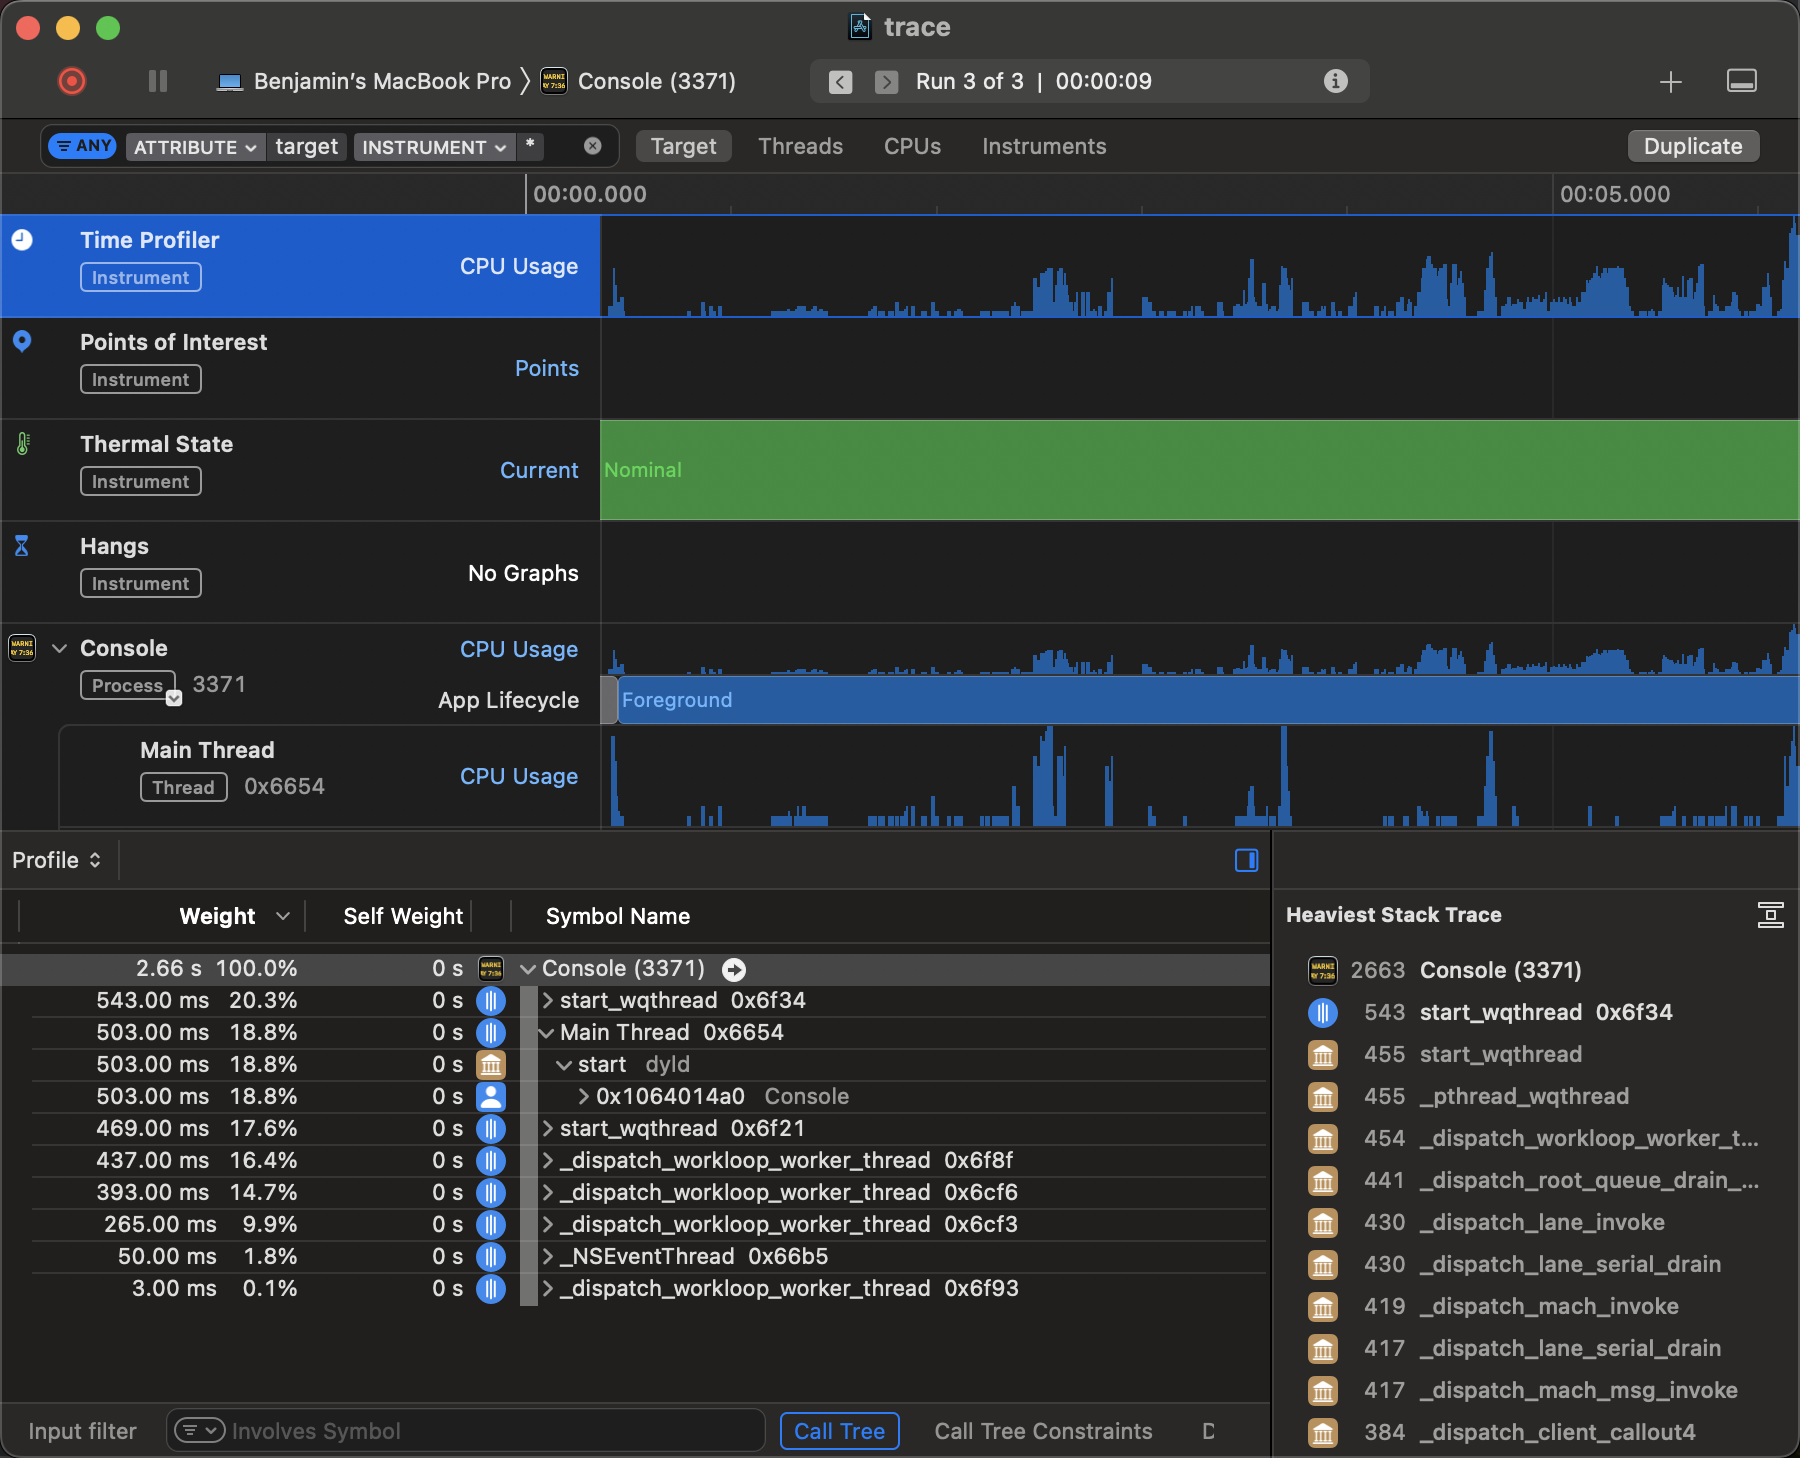
Recently, I've begun doing iOS performance engineering and have been exploring Instruments for collecting and analyzing performance data. Typically, my performance workflow begins by collecting sampling profiler data, which can be easily done using Instrument's Time Profiler. With sampling profiler data, I first look at where the most CPU time is being spent using Flame Graphs or analyze the flow of execution by looking at Stack Charts (time-ordered samples). Surprisingly, Instruments does not provide these views. It only provides a Call Tree view.
To address this, I built instruments-to-gecko, which converts Instrument's trace format into the Gecko format used by Firefox Profiler, a powerful browser-based sampling profiler viewer.
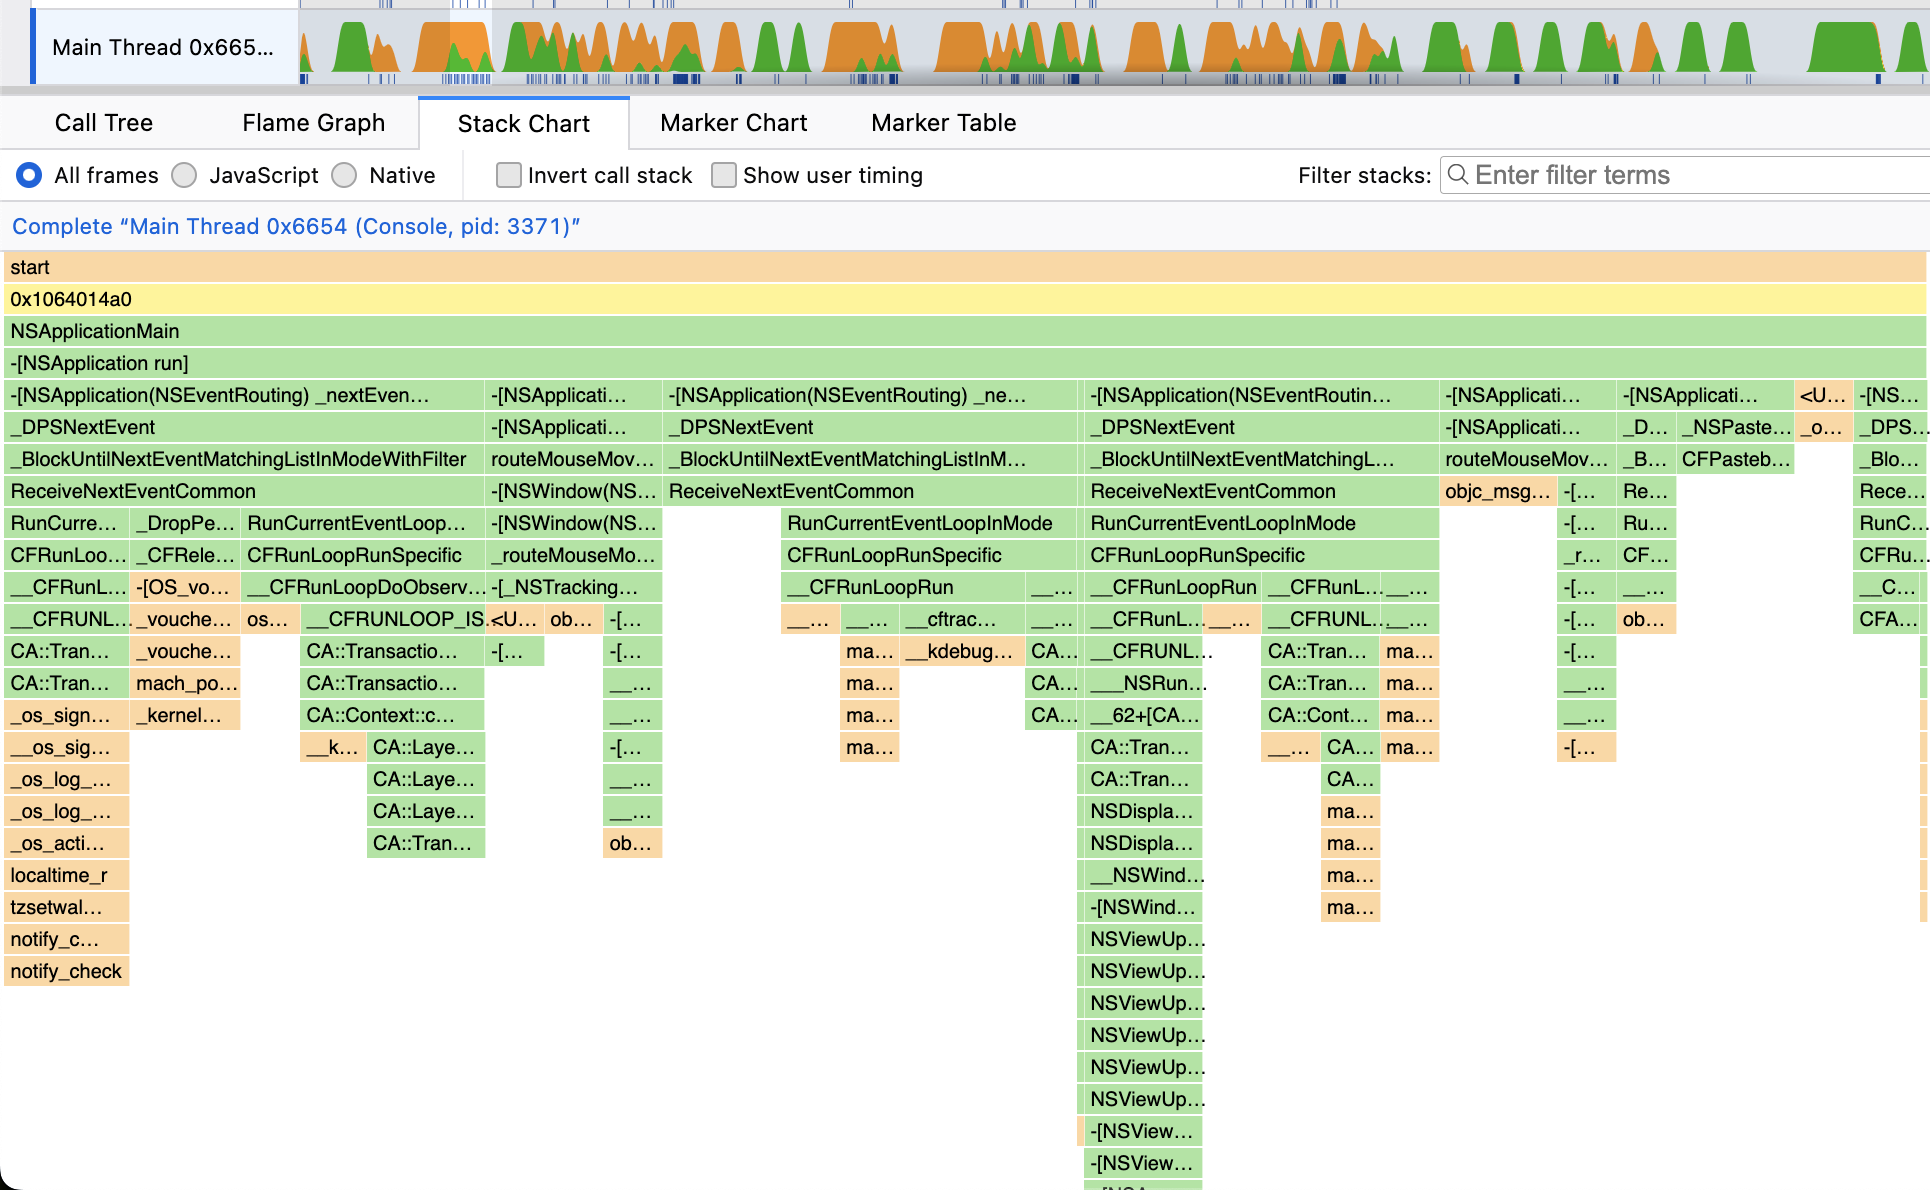
Stack Chart View of Console app's main thread in Firefox Profiler (Example)
While building this tool, I ran into some challenges extracting symbolicated call stacks, the call stack with the original symbols (i.e. function names), from traces. Using some clever tricks, I was able to find a path forward until support for extracting symbolicated call stacks from traces was introduced in XCode 14.3. Although the workaround is no longer necessary, the process is still instructive to walk through as it demystifies symbolication and trace data extraction.
Instrument's Trace Format
To start, traces are effectively a directory with binary-encoded files nested within. The specifications for those files is not public; but, it can technically be reverse engineered using private headers.
Fortunately, in XCode 12, Apple introduced xctrace, a command line utility, to programmatically expose the underlying
data as XML. By using the command, xctrace export --input <INPUT> --toc, a table of contents for the trace can be
exported:
...
<run number="1">
...
<data>
<!-- Time profile table -->
<table target-pid="SINGLE" context-switch-sampling="0" high-frequency-sampling="0" schema="time-profile" needs-kernel-callstack="0" record-waiting-threads="0"/>
<!-- KDebug strings -->
<table codes=""33,0x11"" schema="kdebug-strings" target="SINGLE"/>
<!-- KDebug events -->
<table codes=""46,2"" schema="kdebug" callstack="user" target="SINGLE"/>
<!-- More tables... -->
</data>
</run>
Alternatively, the data within the trace can be interactively explored using Instrument's Inspector window
(Document > Inspector).
Time Profiler Data
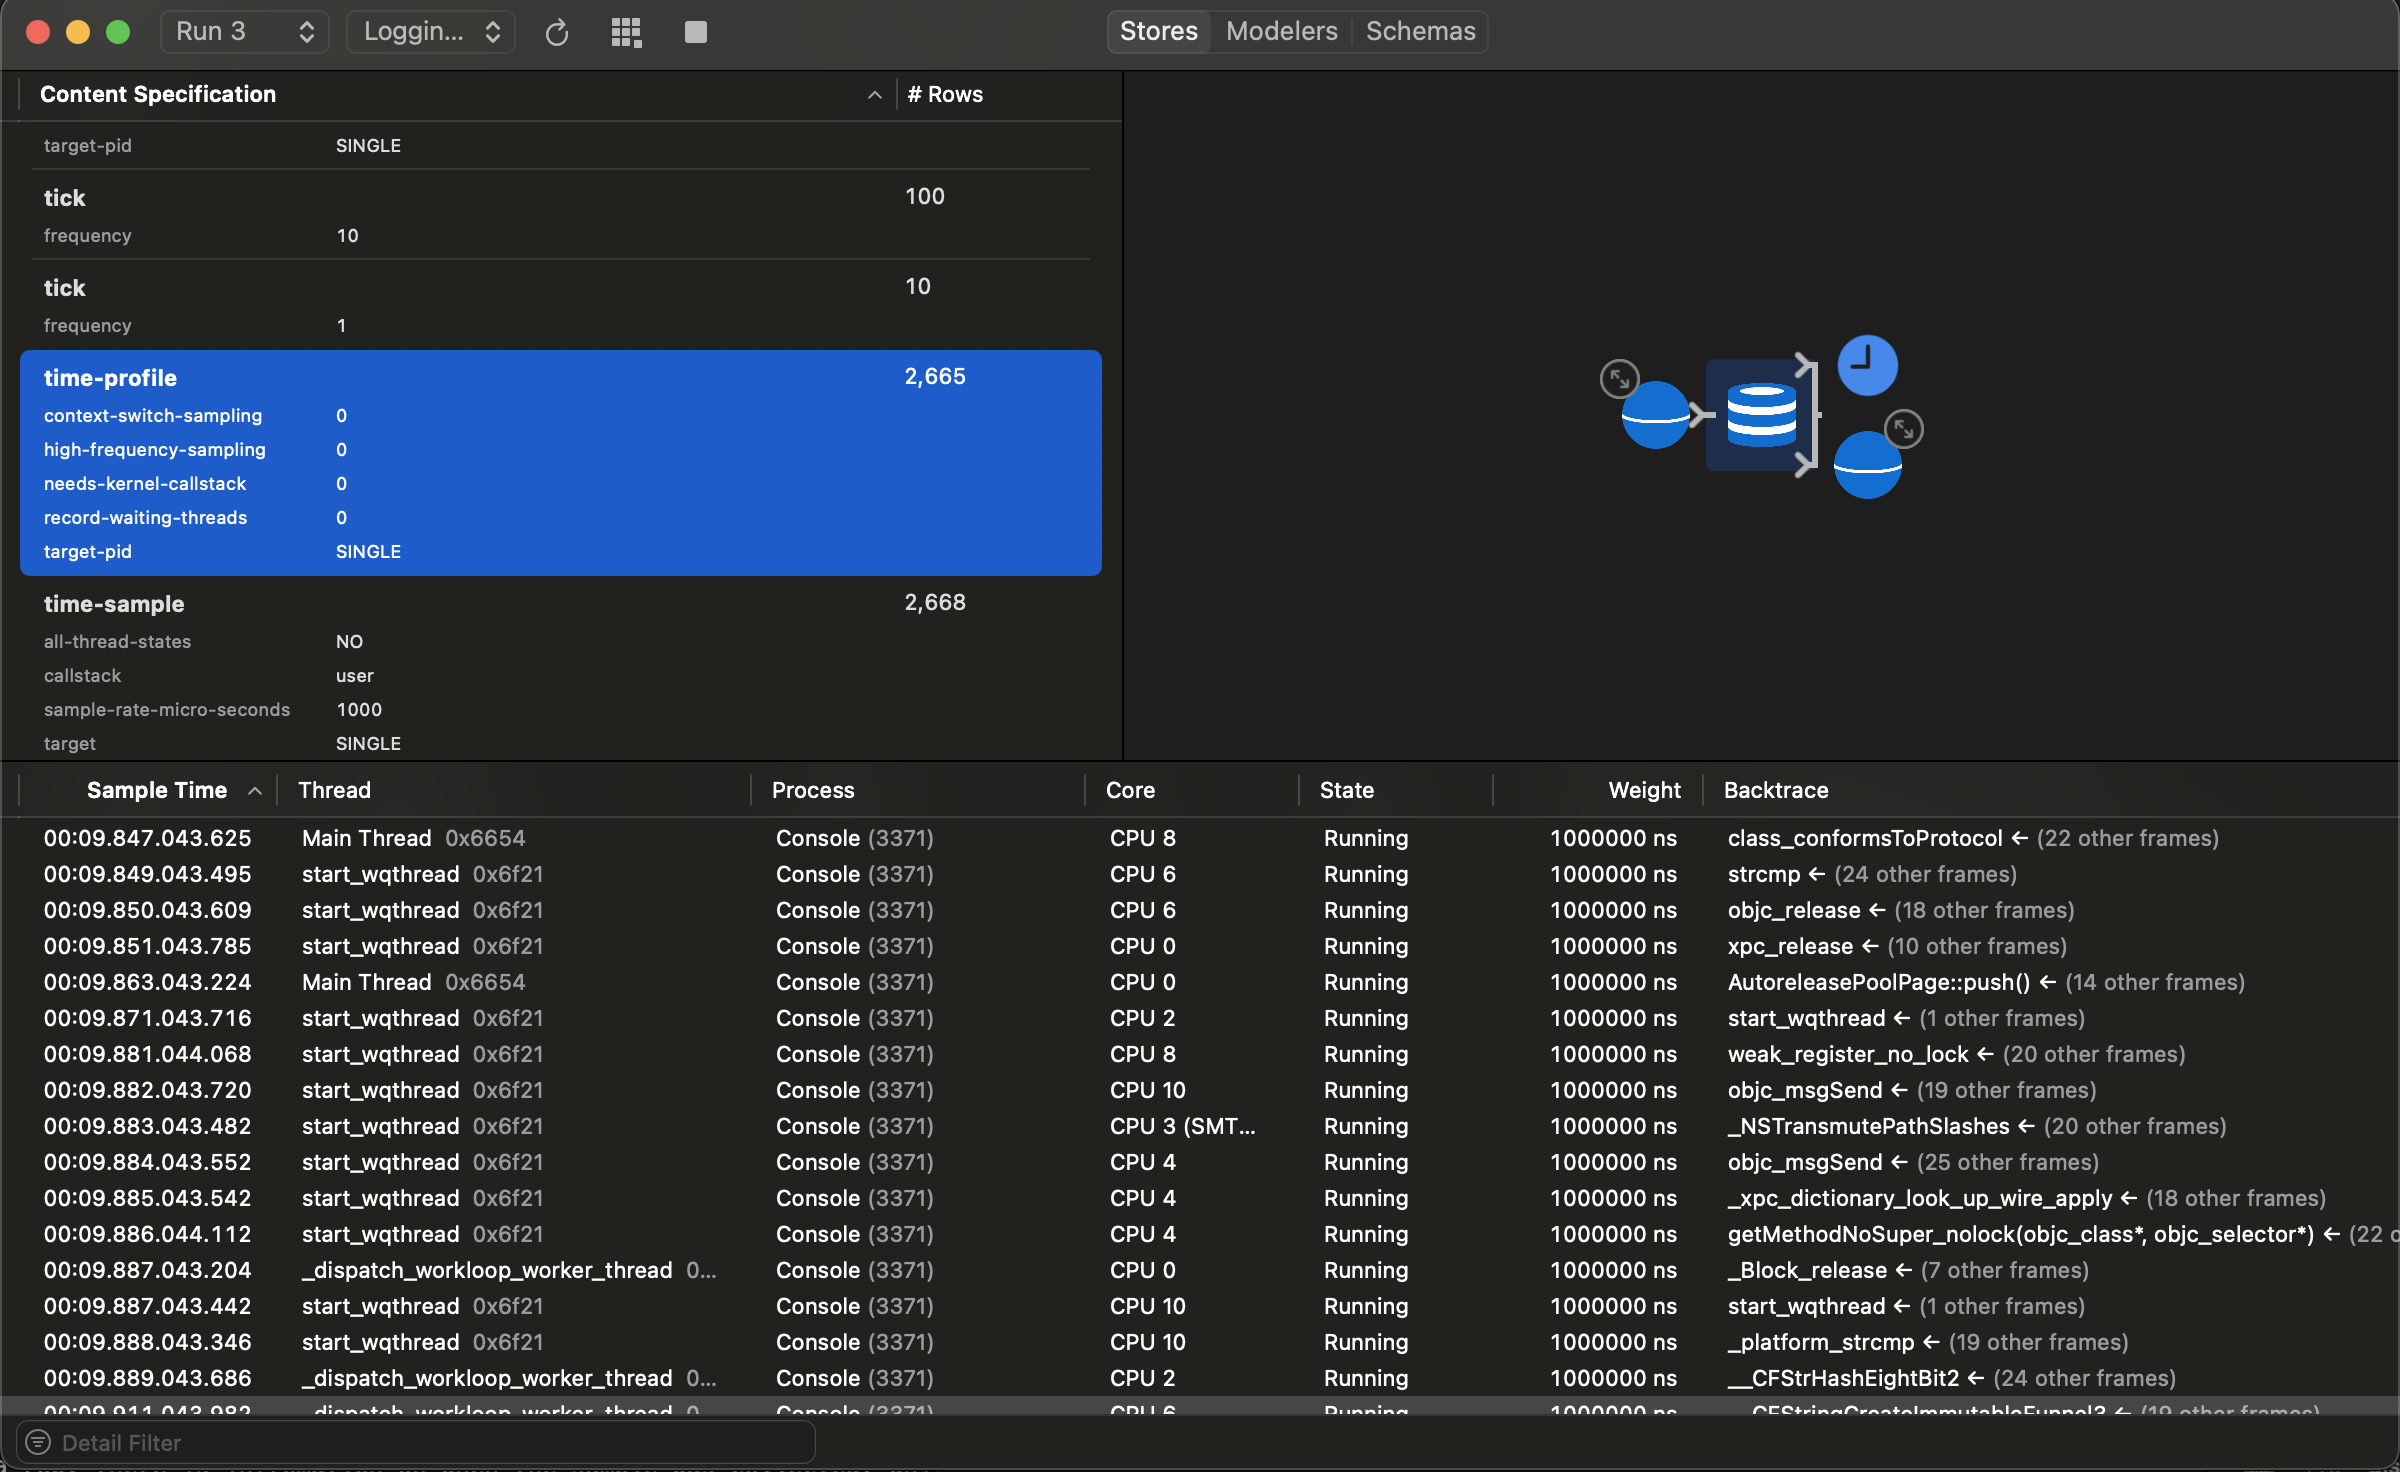
From the table of contents, we saw that there was a Time Profiler table within the trace. Data from this table can
subsequently be exported by passing an xpath to xctrace:
xctrace export --input <TRACE> --xpath '/trace-toc[1]/run[1]/data[1]/table[@schema="time-profile"]'
This outputs a list of rows with each row corresponding to a sample collected by Time Profiler. Specifically, the row contains when the sample was collected, which thread it was collected from and the backtrace. Before XCode 14.3, the backtrace would only contain the raw addresses and not the symbols.
 <row>
    <!-- Time at which the sample was collected -->
     <sample-time id="177" fmt="00:00.411.046">411046250</sample-time>
    <!-- The thread the sample was collected on. -->
    <thread id="54" fmt="_dispatch_workloop_worker_thread  0x627b (Instruments, pid: 3221)">
        <tid id="55" fmt="0x627b">25211</tid>
        <process ref="40"/>
    </thread>
     <process ref="40"/>
    <core ref="171"/><thread-state ref="172"/>
    <weight ref="173"/>
     <!-- The backtrace of the sample -->
     <!--  Each `text-address` corresponds to a frame in the call stack sampled -->
     <backtrace id="178" fmt="0x11d690681 ← (1 other frames)">
        <process ref="40"/>
         <!-- Text Address is the raw address for a given frame -->
        <text-addresses id="179" fmt="frag 801">4788389505</text-addresses>
        <process ref="40"/>
         <text-addresses id="180" fmt="frag 802">4788032064</text-addresses>
     </backtrace>
</row>
Given the table is quite large and XML is verbose, xctrace uses "reference" nodes to avoid duplicating data. In the
example below, the <process> node has a ref attribute which points back to an "original" node (a node with an id
attribute).
<!-- Original node -->
<process id="40" fmt="Console (3221)">
    <pid id="5" fmt="3221">3221</pid>
</process>

<!-- Reference node -->
<process ref="40" />
Symbolicating Backtraces
Now that we've gotten the backtraces, the next step is to figure out how to symbolicate the raw addresses back to the original symbol.
In theory, symbolication is quite simple. Source code is compiled into a binary containing functions and their associated instructions. Then, the address of a function is roughly just the byte offset into the binary. Additionally, at compile-time debug symbols1 are generated which provides a mapping of the function address to the original symbol. Given a backtrace, which is just a stack of function addresses, we can take the debug symbols and trivially symbolicate.
Unfortunately in practice, symbolication is not that easy. At runtime, a function's address is not equivalent to the byte offset of the function within the binary. A binary is mapped into virtual memory at an arbitrary address2. If it wasn't, the function addresses of two binaries would conflict!
So to symbolicate, we need three things:
- Debug Symbols - the mapping of function addresses to symbols
- Raw Address - the function address in virtual memory
- Load Address - the starting address of the binary in virtual memory
By subtracting the Load Address from the Raw Address, we get the original address (i.e. byte offset of the function in the binary) and can use the debug symbols to map back to the symbol.
This is effectively what Instrument's Time Profiler UI does behind the scenes to render symbolicated call stacks. Notably, Instruments allows call stacks to be symbolicated at a later time so the trace must be storing the load addresses for each binary referenced.
Now the question is, can we extract the load addresses from traces using xctrace?
Finding Load Addresses
Going back to the Table of Contents, we see that there is a kdebug table, containing kernel debug tracepoints, and a
kdebug-strings table containing strings referenced by those kernel tracepoints.
Fortunately, dyld, the library responsible for
dynamically loading libraries, does emit a
kdebug tracepoint
with both the binary name and load address.
// call kdebug trace for each image
if ( kdebug_is_enabled(KDBG_CODE(DBG_DYLD, DBG_DYLD_UUID, DBG_DYLD_UUID_MAP_A)) ) {
    // add trace for dyld_sim itself
    uuid_t dyldUuid;
    ((MachOAnalyzer*)dyldSimLoadAddress)->getUuid(dyldUuid);
    fsid_t             dyldFsid    = { { sb.st_dev, 0 } };
    fsobj_id_t         dyldFfsobjid = *(fsobj_id_t*)&sb.st_ino;
    dyld3::kdebug_trace_dyld_image(DBG_DYLD_UUID_MAP_A, info.imageFilePath, &dyldUuid, dyldFfsobjid, dyldFsid, info.imageLoadAddress);
}
Following through the indirection and arch-specific logic of dyld3::kdebug_trace_dyld_image, we can determine the data
is emitted through the following sequence of tracepoints in the kdebug table:
<!-- KDBG_CODE(DBG_DYLD, DBG_DYLD_UUID, DBG_DYLD_UUID_MAP_A) -->
<row>
    <kdebug-class id="..." fmt="0x1F">31</kdebug-class>
    <kdebug-subclass id="..." fmt="0x5">5</kdebug-subclass>
    <kdebug-code id="..." fmt="0x0">0</kdebug-code>
    <!-- String ID pointing to binary -->
    <kdebug-arg id="..." fmt="0x86a4">34468</kdebug-arg>
    ...
</row>
<!-- KDBG_CODE(DBG_DYLD, DBG_DYLD_UUID, DBG_DYLD_UUID_MAP_B) -->
<row>
    <kdebug-class id="..." fmt="0x1F">31</kdebug-class>
    <kdebug-subclass id="..." fmt="0x5">5</kdebug-subclass>
    <kdebug-code id="..." fmt="0x0">0</kdebug-code>
    <kdebug-arg id="..." fmt="...">...</kdebug-arg>
    <!-- Load Address -->
    <kdebug-arg id="..." fmt="0x86a4">34468</kdebug-arg>
    ...
</row>
Lastly, we can take the string ID in the kdebug arg and map it back to the binary name using the kdebug-string table:
<!-- fmt attribute contains the string ID -->
<string id="1" fmt="34468">
    <raw-string>{binary name}</raw-string>
</string>
Finding Debug Symbols
The last bit before symbolicating is finding the debug symbols. For System Frameworks on iOS <17, these are stored under the DeviceSupport directory. For example:
~/Library/Developer/Xcode/iOS\ DeviceSupport/16.1\ \(20B82\)\ arm64e/Symbols/<libraryName>
For your own application, a .dSYM file can be generated by setting Debugging Information Format for the XCode
project to DWARF with dSYM File.
Symbolicating
Finally, we can symbolicate by using atos which takes in a .dSYM, a load address and a list of addresses. For each
binary loaded, we need to pass the entire list of addresses observed in the backtraces. If the .dSYM contains a match
for the address, the output will contain the symbol name; otherwise, the address passed in will be returned.
# arm64e for physical devices, x86_64 for simulators on Intel macs
# Provide a file with all possible addresses in hex format (e.g. 0x11d690681)
# The output will contain either the original address if no match is found or the matching symbol
#
# Note: This is quite slow. It takes ~1m30s to process ~800 dSYMs even with parallelization on an M1.
atos -arch arm64e -o <dSymFile> -l <loadAddress> -f <file with all addresses>
After iterating through all .dSYM files, the list should be fully symbolicated. Lastly, iterate through the backtraces
using the newly generated address to symbols mapping to complete the symbolication process. The symbolicated call stacks
can then be converted into arbitrary profile data formats, like
Gecko.
Conclusion
Overall, the approach outlined is complex and brittle. With XCode 14.3, xctrace now exports symbolicated backtraces
removing the necessity for any of this complexity.
<!-- Example XCode 14.3+ backtrace -->
<backtrace id="182">
    <frame id="183" name="tiny_malloc_should_clear" addr="0x7ff813c8cd06">...</frame>
    <frame id="185" name="szone_malloc_should_clear" addr="0x7ff813c8bc3a">...</frame>
    <frame id="186" name="__CFBasicHashRehash" addr="0x7ff813ed35a4">...</frame>
    <frame id="188" name="__CFBasicHashAddValue" addr="0x7ff813ed3145">...</frame>
</backtrace>
The last code for converting Instruments to Gecko can be found here and pre-XCode 14.3 implementation here.
Special thanks to Alejandro Lucena who proposed the dyld KDebug tracepoint approach for finding load addresses